


Blog
Latest insights and updates
Logistics & Delivery: Fewer kilometers, higher on-time AI route optimization
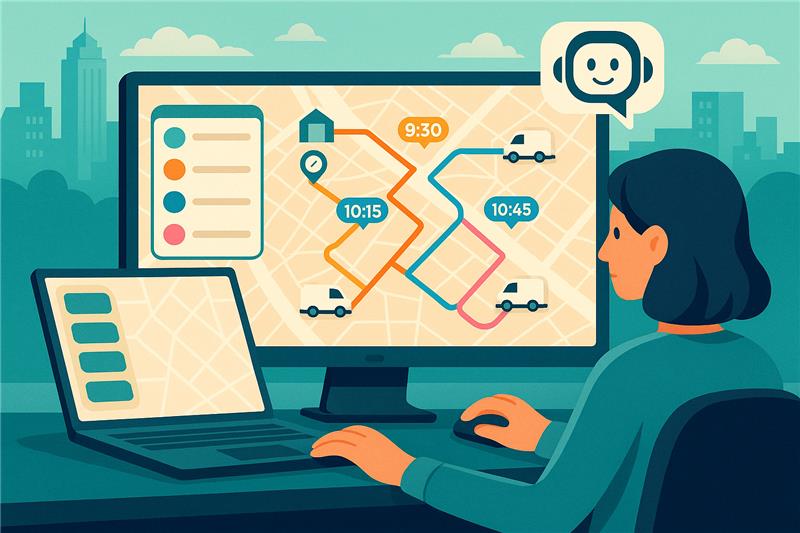
Turn miles into minutes. Dynamic routing that respects time windows, capacity, driver constraints, and adapts to real-world chaos in real time.
Quick summary (60s)
AI route optimization assigns the right stops to the right vehicles and chooses the best sequence under constraints (time windows, capacity, driver shifts, SLAs). It then re-optimizes live when reality shifts (traffic, cancellations, add-on orders). Teams typically see distance down, on-time rate up, fewer reattempts, and calmer dispatch. Start with a scoped 21-day pilot, lock a clean baseline, and scale.
Deploy on-premises or in a private cloud so sensitive operational data stays under your control by default.
Who this helps
- Last-mile: e-commerce, grocery, pharmacy, foodservice
- Field service: maintenance, technicians, meter reading
- B2B distribution: FMCG, HoReCa supply, cash collection
- Dark stores & ship-from-store fleets
Why now
Margins are thin, traffic is volatile, SLAs are stricter. Manual drag-and-drop planning struggles with:
- Time windows & SLAs per customer
- Vehicle capacity (weight/volume/pallets) & special equipment (reefer, lift-gate)
- Driver constraints (shift hours, breaks, territory familiarity)
- Live disruptions (traffic spikes, no-shows, urgent insertions)
- Fairness & stability (balanced workload, minimal churn day-to-day)
How it works (plain English)
- The engine solves a Vehicle Routing Problem (VRP) with Time Windows (TW) and Capacity (CVRP):
- Optimizes assignment (which vehicle handles which stops) and sequence (best visit order)
- Adds stability (avoid reshuffling routes for tiny gains) and fairness (balanced workload)
- Supports dynamic re-optimization during the day (safe insertions, swaps, resequencing)
Glossary: VRP = Vehicle Routing Problem; TW = Time Windows; CVRP = Capacitated VRP.
What you feed it (inputs)
- Orders/stops: address/geocode, service time, priority, time windows
- Fleet: vehicles, capacities, equipment, depots
- Drivers: shifts, breaks, territories, speed profiles
- Constraints: max route duration/distance/stops; SLAs; skills
- Signals: traffic & closures, historical delays, real-time events
What you get (outputs)
- Per-vehicle routes with ETAs and navigation hand-off
- Dispatcher console: live map, alerts, what-if simulation
- Driver mobile: stop list, turn-by-turn, proof of delivery (photos/signatures/PIN)
- KPI dashboard: distance, on-time %, first-attempt success, manual edits
The KPIs that matter (measure before → after)
- Total kilometers (per day / per order)
- On-time rate (OTR) within SLA windows
- First-attempt success rate (fewer reattempts)
- Stops per route & route duration variability
- Driver utilization (productive vs idle time)
- Dispatcher interventions per shift
- Customer rating / complaint rate post-delivery
Tip: fix a two-week baseline and keep comparison periods identical.
21-day pilot plan (low risk, high clarity)
Week 1 --- Instrument & baseline
- Pick a zone (5--20 vehicles; 300--1,500 daily stops)
- Connect data (orders, fleet, drivers). Validate geocodes & time windows
- Model constraints & SLAs; set KPI targets & guardrails
- Capture the baseline: distance, OTR, reattempts, dispatcher edits
Week 2 --- Shadow & simulate
5. Run AI planning in shadow mode alongside your current process
6. Compare feasibility & cost; tune service times and penalties
7. Train dispatchers & drivers (mobile app, exception flows, re-opt
behavior)
Week 3 --- Limited go-live
8) Go live for the pilot zone; monitor ETAs & exceptions in real time
9) Re-opt for add-on orders & cancellations; test customer
notifications
10) Close with a before/after KPI report; decide on scale-up
Architecture blueprint (reference)
Flow
OMS/WMS/Store systems → Route Optimization Engine → Dispatcher
Console & Driver App → Analytics (Grafana/Metabase) → Data Warehouse.
Components
- Route Optimization Engine (local-first capable), VRP+TW, dynamic re-opt, stability & fairness controls
- Driver mobile, stop list, navigation hand-off, POD (photos/signatures/PIN)
- Dispatcher console, live map, alerts, overrides, what-if simulation
- Notifications, WhatsApp/SMS/email for ETAs & reattempts
- Observability, logs, metrics, traces; SLA breach alerts
- Governance, roles/tenants, audit trails, data residency, GDPR alignment
Design choices you'll make (and why)
- Objective weighting: pure distance vs on-time vs first-attempt success
- Stability vs optimality: lock first/last stops; penalize big reroutes midday
- Territories: hard (always the same) vs soft (mostly the same) boundaries
- Fairness: balance routes so drivers accept plans and turnover stays low
- Insertion policy: when to accept a late order and how to place it safely
- Proof of delivery: photos, signatures, PIN codes; when to require which
Data quality checklist (don't skip)
- Addresses geocoded to rooftop or high-precision centroid
- Realistic service times per customer type
- Accurate time windows; VIPs tagged with true SLAs
- Vehicle capacity (weight/volume/pallets) + equipment captured
- Driver shifts & breaks reflected (incl. local labor rules)
- Historical delays labeled (elevators, site access, security)
Integrations that move the needle
- WhatsApp/SMS ETAs with confirm/deny to reduce no-shows
- POS/ERP sync for daily fleet & inventory
- POD to ERP in near real-time
- AI exception handling: flag risky routes before they fail
Risks & how we mitigate
- Bad geocodes → pre-pilot cleanse & auto-correct pipeline
- Unrealistic time windows → publish standards; tag VIPs accurately
- Over-optimization churn → stability penalties; lock critical stops
- Driver pushback → co-design, mentors, visible scorecards
Simple ROI frame (illustrative)
Value levers: fewer kilometers, fewer reattempts, higher OTR, higher capacity/vehicle, less dispatcher time.
Savings ≈ (km_reduction × cost_per_km)
- (reattempt_reduction × cost_per_attempt)
- (dispatcher_hours_saved × hourly_rate)
Scale when Savings > License + Enablement + Minimal Devices.
FAQs (short & practical)
Is this only for huge fleets?
No. Value often starts around 5--10 vehicles when time windows are tight
and traffic is variable.
Can we keep data on-prem?
Yes. On-prem or private cloud deployments are supported.
Will drivers accept the plans?
Tune for stability and fairness and keep a human override.
Adoption rises when routes feel familiar and balanced.
How fast to first value?
A scoped pilot yields measurable results in 21 days with a clean
baseline.
Implementation checklist
- Baseline KPIs captured (≥ 2 weeks)
- Clean addresses & service-time estimates
- Fleet & driver constraints modeled
- Dispatcher console and driver app tested
- Notifications & POD integrated
- Governance: privacy mode (edge/region), roles, audits
Call to action
Kick off a 21-day pilot. We'll instrument your baseline, go live in
one zone, then deliver a before/after KPI report.
TBen Innovation --- AI Solutions Team
contact@tbeninnovation.com ·
www.tbeninnovation.com
Share it!
Continue Reading